
 ·
5 minute read
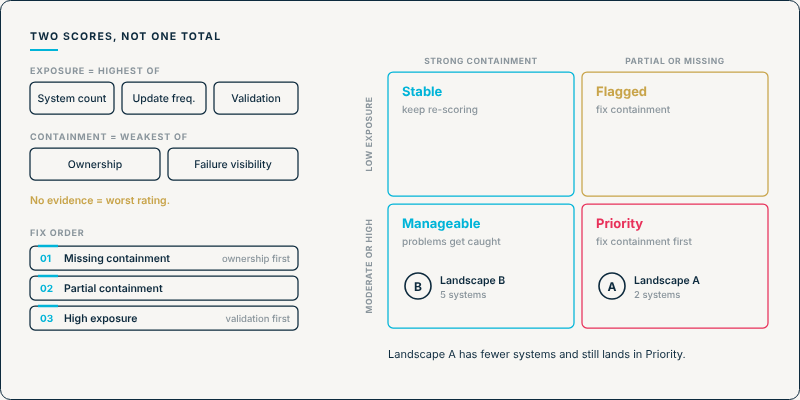
This scorecard gives an Airtable landscape two ratings instead of one: how exposed it is, and how well it contains problems when they happen. Together, those two ratings place the landscape on a grid and produce an ordered list of what to fix. Every rating comes from evidence you can point to, not from what the team believes to be true.
What a Finished Scorecard Looks Like
Here are two landscapes, scored. Both come from why more Airtable integrations doesn't mean more risk.
Landscape A: two systems. The CRM rewrites every customer record in Airtable every few minutes, writes land directly in production, there's no written ownership rule, and nothing compares the two systems.
Landscape B: five systems, each writing to Airtable through a documented path. Syncs push only changed records, often enough for each field's tolerance. Every incoming write lands in a holding table and passes a validation check before reaching production. A written document, kept current, names the authoritative system for every shared field. A scheduled job compares key fields and logs mismatches to a view that a named owner reviews. The team has tested both a forced mismatch and a forced write failure in a sandbox, and each one reached its named owner.
|
Factor |
Landscape A |
Landscape B |
|
System count |
Low |
Moderate |
|
Update frequency |
High |
Low |
|
Validation |
High |
Low |
|
Exposure (highest) |
High |
Moderate |
|
Ownership |
Missing |
Strong |
|
Failure visibility |
Missing |
Strong |
|
Containment (weakest) |
Missing |
Strong |
|
Grid position |
Priority |
Manageable |
Landscape A has fewer systems and still lands in the worst position. Its exposure comes from how it syncs and where writes land, not from how many systems it has, and it has no containment at all. The steps below show how each of those ratings was reached.
Before You Start: Gather the Evidence
The scorecard rates the five factors of Integration Load, InAir's framework for measuring integration risk. Each factor has one piece of evidence behind it:
- System count: an inventory of every system, access token and webhook that writes to the base.
- Update frequency and scope: each sync's run history, plus the frequency check in why update frequency changes your integration risk [DRAFTED, NOT LIVE: Cluster 2.1.2].
- Validation: where incoming third-party writes land.
- Ownership: a written document naming the authoritative system for each shared field, as described in Cross-System Source of Truth: who owns a field when Airtable isn't the only system writing to it.
- Failure visibility: a failure or disagreement forced in a sandbox. Testing whether a failure reaches its owner is covered in alert ownership. Testing whether a quiet disagreement surfaces at all needs a comparison job like the one in building a cross-system agreement check.
One rule applies to every factor: if the evidence can't be produced, the factor gets its worst rating. The scorecard exists to test assumptions like "we'd notice" or "everyone knows the CRM owns that field," so an assumption can't count as evidence.
Step 1: Rate Exposure
Exposure factors set how much could go wrong and how often. Rate each one Low, Moderate, or High.
|
Factor |
Low |
Moderate |
High |
|
System count |
One system writes shared data |
Several systems write through a central hub or documented paths |
Several systems write directly to the same tables through undocumented paths, or the inventory can't be completed |
|
Update frequency and scope |
Syncs push only changed records, and shared fields arrive within their tolerance |
Some syncs rewrite every record on a long interval, or some fields arrive later than their tolerance |
Any sync rewrites every record on a short interval, or real run rates are unknown |
|
Validation |
All incoming third-party writes pass through a staging check before production |
Some do |
They land directly in production tables |
The landscape's exposure score is the highest of the three. A single high-exposure factor can cause problems on its own, and when it's combined with the others, the effects compound.
Step 2: Rate Containment, One Integration at a Time
Containment factors decide whether a problem stays small and gets caught. Rate each one Strong, Partial or Missing, separately for every integration.
|
Factor |
Strong |
Partial |
Missing |
|
Ownership |
The written document covers every shared field this integration touches, and has been reviewed since the integration last changed |
It covers some fields, or is out of date |
No written document |
|
Failure visibility |
The forced failure surfaced and reached a named owner |
It surfaced but didn't reach an owner, or only some failure types were tested |
Nothing surfaced, or it was never tested |
The landscape's containment score is the weakest rating across all its integrations, not the average. A landscape can have strong ownership rules everywhere except one forgotten legacy connection, and that connection is where a disagreement can go unnoticed. An average would hide it.
Step 3: Place the Landscape on the Grid
Moderate exposure counts as high here, and Partial containment counts as weak. That's the cautious reading.
|
Strong containment |
Partial or Missing containment |
|
|
Low exposure |
Stable. Keep re-scoring when the landscape changes. |
Flagged. Problems are less likely, but the ones that happen can go unnoticed. Fix containment. |
|
Moderate or High exposure |
Manageable. Problems can happen and get caught. Reduce exposure when it's practical. |
Priority. Problems are more likely and can compound without anyone noticing. Fix containment first. |
Weak containment is flagged whatever the exposure. A landscape with little exposure is only as safe as its ability to catch the problems it does have.
Step 4: Work Through the Fix Order
The scorecard ends with a list, not a grade. InAir's recommended order:
- Missing containment ratings, starting with ownership. Until each shared field has a named authoritative system, disagreements can be found but not resolved consistently.
- Partial containment ratings. For example, failures that surface but don't reach an owner, or disagreements nothing is set up to detect.
- High exposure ratings, starting with validation. Where writes land is often quicker to change than how systems are connected. A holding table for third-party writes is covered in building a staging layer for third-party webhooks. After that, limit syncs to changed records, covered in change detection for Airtable integrations. Then address system count and topology, which often take the longest to change.
For Landscape A, that means writing the ownership rules first, then setting up a way to detect disagreement, then adding a holding table and limiting the sync to changed records.
Why the Two Scores Stay Separate
Adding the five ratings into one total would be simpler, but it would hide the difference that matters. A landscape with many systems and strong containment can end up with the same total as a small one where nothing is owned or watched. In the first, problems can happen but get caught. In the second, problems may be rarer, but any one of them can sit unnoticed for months.
That's the argument behind the second act of InAir's guide to running Airtable inside complex, high-volume system landscapes: the factors compound, so a checklist scored independently on each one doesn't represent the actual risk. The case for fixing containment before exposure is made in full in exposure vs. containment: the two kinds of integration risk.
When to Score Again
A score describes the landscape on the day it was taken. InAir's view, set out in Managing the Living Ecosystem: Why Static Architecture Always Fails, is that an enterprise architecture is a living ecosystem, not a static deployment. Re-score when:
- a new system is onboarded;
- a new system could write to a field that already has an owner;
- any integration involved in ownership or failure detection is modified.
This scorecard covers the integration landscape specifically. For the broader view of what leadership assesses before scaling Airtable, including governance maturity, control confidence and institutional resilience, see What Enterprise Leaders Evaluate Before Scaling Airtable.
If you'd rather work through it with a team that assesses enterprise Airtable environments, and leave with a plan instead of a score, Schedule a Discovery Call with InAir to score your landscape with us.